
Allsvenskan 2026 - simulated one million times
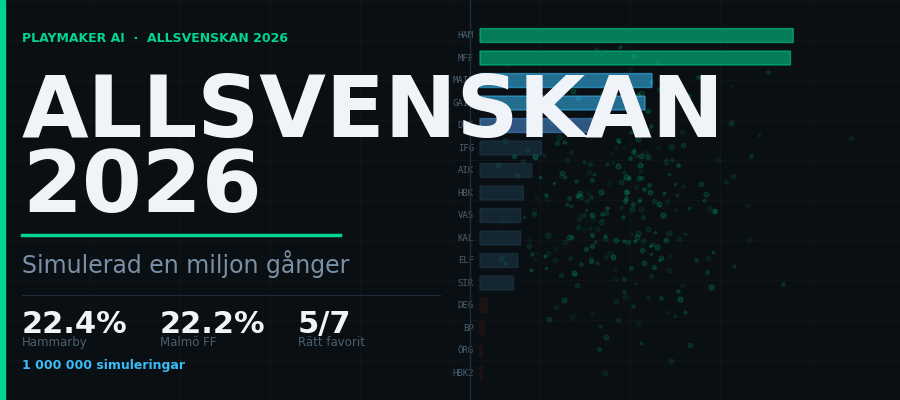
There is a growing trend in Swedish football — and football in general — to talk about KPIs, or key performance indicators. Ahead of this season I have done a significant amount of work digging into one of the most common questions we get at Playmaker: which KPIs should I look at if I want to succeed? Which metrics are actually linked to winning football matches?
The short answer is that there is no single answer. There is no silver bullet, no KPI that alone explains success. If there were, everyone would already be using it. Football is more complex than that.
That said, there are KPIs that clearly correlate with teams that win matches. Ahead of this season I looked through our by now enormous database of historical team seasons and analysed how different KPIs relate to league position. In practice, I analysed well over a thousand historical team seasons, picked out some of our most commonly used KPIs and examined which ones actually correlate with success — and conversely, which ones correlate with finishing lower in the table.
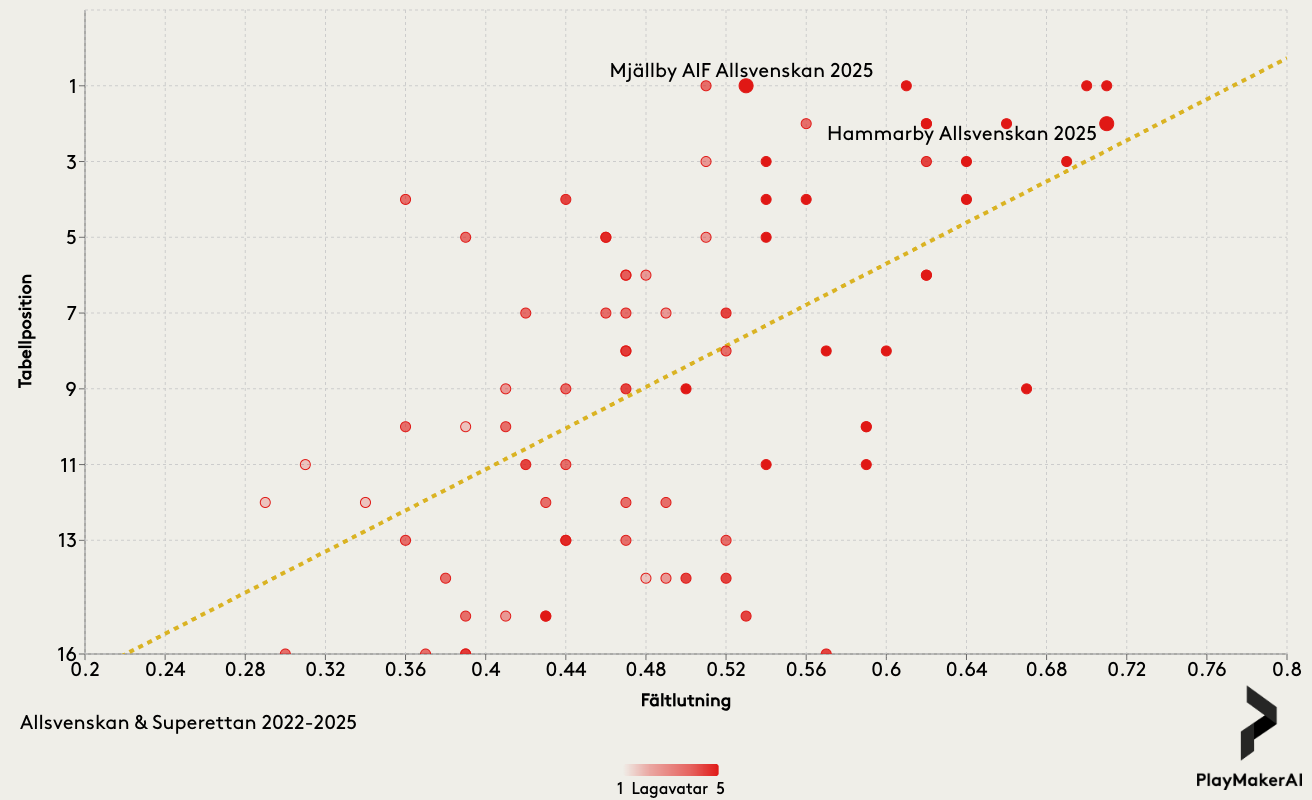
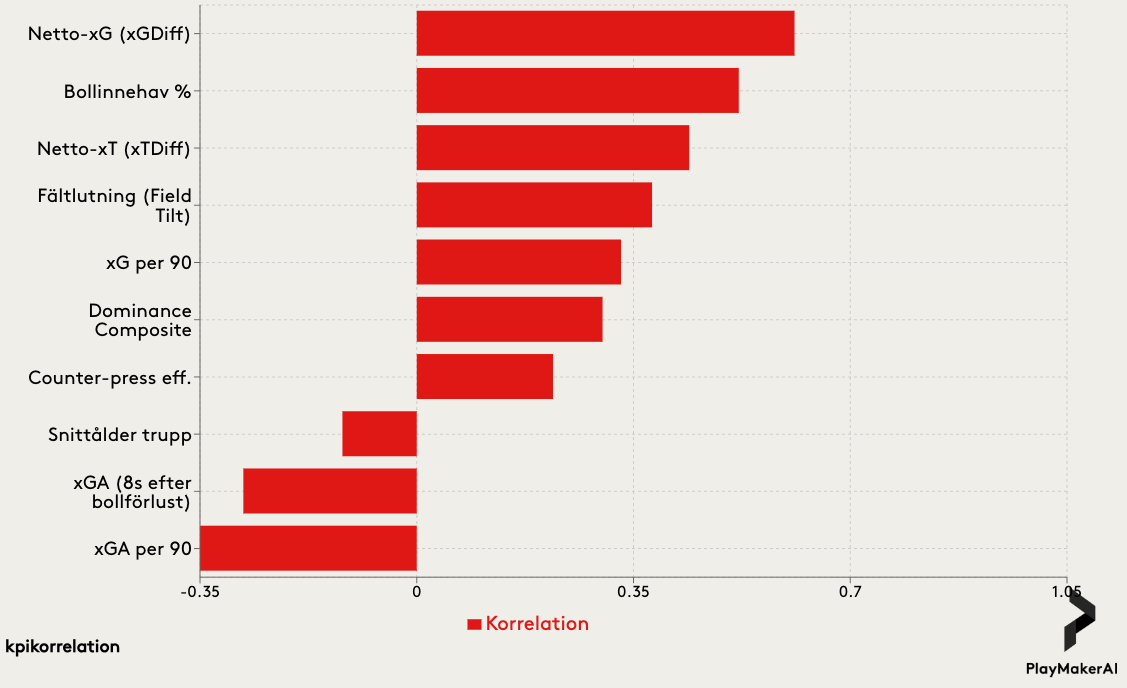
A couple of things surprised me. One of them is field tilt. Field tilt measures the share of actions your team has in the final third compared to the number of actions the opponent has in your final third. Below we show the relationship between league position and some of the most common KPIs in the platform. A higher value indicates a stronger positive correlation with a higher table position — and the reverse for negative values.
Avatars – what is the team actually trying to do?
The next thing I want to talk about is something you may not immediately recognise among the KPIs: avatars. Avatars are our way of approaching the problem by not just looking at what we usually call output. Output is fundamentally the result of a team's quality — a high xG, for example, is a consequence of how you play. Avatars instead try to capture what a team is actually trying to do on the pitch. We have identified five different playing styles.
What I really want to emphasise — and what may be the most interesting finding in this study — is the connection between these playing styles and success. Which avatars are associated with finishing at the top, and which with the opposite?
The answer is clear. A style based on deep defending and transitions — what we call Low Defence & Direct — almost never wins a league. Looking at all seasons in the database, it is statistically near-absent at the top of the table. The style with the strongest link to success is Possession & High Press. Among the four highest-ranked teams in this season's simulation, you find three teams with that avatar. Among the teams the model places at the bottom, you find the opposite. This is not random. It is a pattern that holds across leagues and seasons.
Among all the KPIs we use beyond avatars, net xG and field tilt are among the strongest individual predictors in the model. Teams that dominate the ball and press high win — not every match, but over a full season.
The model and the simulation
Using these insights as a foundation, I built a simulation model that takes all of these KPIs into account — how they looked during the previous season and how they influence the following season's results. An additional strength is that we also include data from the Swedish Cup, which is factored in but weighted down slightly since fewer matches are played. On top of that we add further dimensions such as average squad age and squad value — factors that have been part of the simulation for a long time. What is new is that we now to a greater extent quantify teams' playing styles through the avatars.
This is the eighth consecutive year we have done this. It is genuinely starting to feel like a small Allsvenskan tradition. Why do we do it? Partly because the simulation has proven to work — we will come back to that — but above all because it is a fun technical challenge. It can be done, so we do it. This time the simulation took almost 20 hours to run. One million times. Every team in Allsvenskan 2026 has played a full season one million times, and what you see below is the combined result.
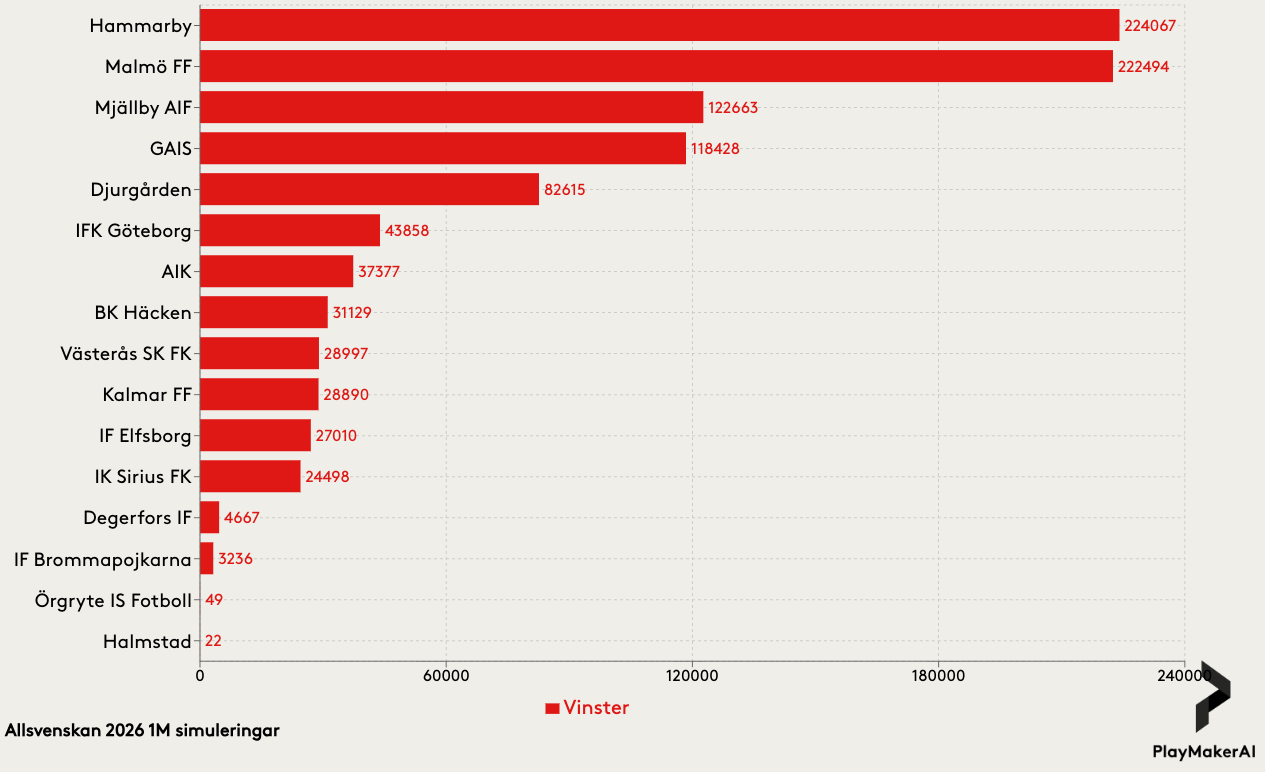
The result – 1,000,000 simulations
| # | Team | Prev. | Exp. pos | 80% CI | Wins | P(Title) | P(Top 3) | P(Bot 3) |
|---|---|---|---|---|---|---|---|---|
| 1 | Hammarby | 2 | 3.8 | 3–11 | 224,067 | 22.4% | 56.4% | 0.4% |
| 2 | Malmö FF | 6 | 3.9 | 3–12 | 222,494 | 22.2% | 54.9% | 0.7% |
| 3 | Mjällby AIF | 1 | 5.4 | 3–12 | 122,663 | 12.3% | 36.6% | 2.5% |
| 4 | GAIS | 3 | 5.5 | 4–13 | 118,428 | 11.8% | 35.5% | 2.9% |
| 5 | Djurgården | 5 | 7.0 | 4–15 | 82,615 | 8.3% | 25.3% | 8.4% |
| 6 | IFK Göteborg | 4 | 8.1 | 5–15 | 43,858 | 4.4% | 15.8% | 12.1% |
| 7 | AIK | 7 | 8.1 | 5–14 | 37,377 | 3.7% | 14.6% | 10.7% |
| 8 | BK Häcken | 10 | 9.0 | 5–16 | 31,129 | 3.1% | 11.7% | 17.1% |
| 9 | Västerås SK FK | 14 | 8.9 | 6–16 | 28,997 | 2.9% | 11.4% | 15.7% |
| 10 | Kalmar FF | 15 | 8.7 | 5–14 | 28,890 | 2.9% | 11.7% | 13.7% |
| 11 | IF Elfsborg | 8 | 9.1 | 6–16 | 27,010 | 2.7% | 10.6% | 17.0% |
| 12 | IK Sirius FK | 9 | 8.4 | 4–13 | 24,498 | 2.4% | 11.1% | 10.6% |
| 13 | Degerfors IF | 13 | 11.6 | 6–16 | 4,667 | 0.5% | 2.5% | 36.6% |
| 14 | IF Brommapojkarna | 12 | 11.7 | 6–16 | 3,236 | 0.3% | 2.0% | 37.5% |
| 15 | Örgryte IS | 16 | 13.3 | 9–16 | 49 | 0.0% | 0.1% | 54.5% |
| 16 | Halmstads BK | 11 | 13.6 | 10–16 | 22 | 0.0% | 0.0% | 59.6% |
Hammarby and Malmö – essentially a dead heat
Hammarby and Malmö are separated by 1,573 simulation wins out of one million. That is for all practical purposes a dead heat. Hammarby drives its ranking on the back of the best underlying numbers in Allsvenskan over recent seasons. Malmö FF are right there too but underperformed last season — it is their squad value that implies depth in the group. Two slightly different routes to the same destination.
A note on AIK
There is a detail in the data worth flagging. In Allsvenskan 2025, AIK were classified as a Counter Attack & Crosses team. In the 2026 cup data they have shifted avatar — the numbers now point toward Possession Control. This is not something AIK has said at a press conference. It is something that shows up in the game. The model ranks them seventh with just under 15% chance of finishing top three, but if that stylistic shift holds through the season, they are a team to watch.
Mjällby – and a memory from last year
Reigning champions Mjällby AIF land in third place with a 12.3% title probability. That is not surprising to anyone who remembers what last season's simulation looked like — Mjällby were the second most likely winners ahead of Allsvenskan 2025 as well. I put it out publicly. I got a fair amount of ridicule on social media. Then they won the league.

The bottom – "so you're saying there is a chance"
Halmstads BK won 22 out of one million simulations. Twenty-two. That is technically a positive number. The model rules nothing out. But when you combine their KPIs, squad value and historical finishing positions — yeah. I promise to eat my laptop if HBK win Allsvenskan 2026.
The track record – what the model has actually delivered
This is the eighth time we have run the simulation. It has been right in five of seven years — meaning it correctly identified the eventual winner as its top pick.
Four of seven. That may not sound impressive. But put it in context: the model captures roughly half the variance in actual league tables, measured by Spearman correlation — a statistical measure of whether the ranking is correct, where 1.0 is perfect and 0 is random. We average 0.49. Throw a dice and you land on 0. Given that, it is actually fairly strong. Or at least as far as we can currently get when trying to predict Allsvenskan with data.
And remember. Last season the model's strength was in weighting Mjällby up — and it got mocked for it. This season it is Hammarby that carries the strongest underlying numbers. Maybe it is finally starting to be their turn.
We will see.
Read last year's prediction — the one that got me fairly thoroughly ridiculed on social media →